(コードつき)Net Reclassification Improvement (NRI)、Integrated Discrimination Improvement (IDI)のRコード
NRI、IDI、DCAのRコード
前回の記事。
どうも、NRIとIDI、DCAを実装してみました。
データは、お手元の物をご使用ください。
以下、コピペでOK
ーーーーーーーーーーーーーーーーーーーーーー
library(readxl)
library(PredictABEL)
# https://cran.r-project.org/web/packages/PredictABEL/PredictABEL.pdf
# PredictABELの詳細は↑
library(dplyr)
library(caret)
library(rmda)
library(ROCR)
library(ggplot2)
set.seed(42)
calculateNRIandIDI = function(df, cutoff)
{
for (model1 in colnames(df[2:ncol(df)]))
{
model1 = df[model1]
for (model2 in colnames(df[2:ncol(df)]))
{
model2 = df[model2]
if (colnames(model1)!=colnames(model2))
{
print(paste("Comparison of ",colnames(model1)," and ",colnames(model2)))
reclassification(data=df, cOutcome=1, predrisk1=model1[,],
predrisk2=model2[,], cutoff=cutoff)
}
else
{next}
}
}
}
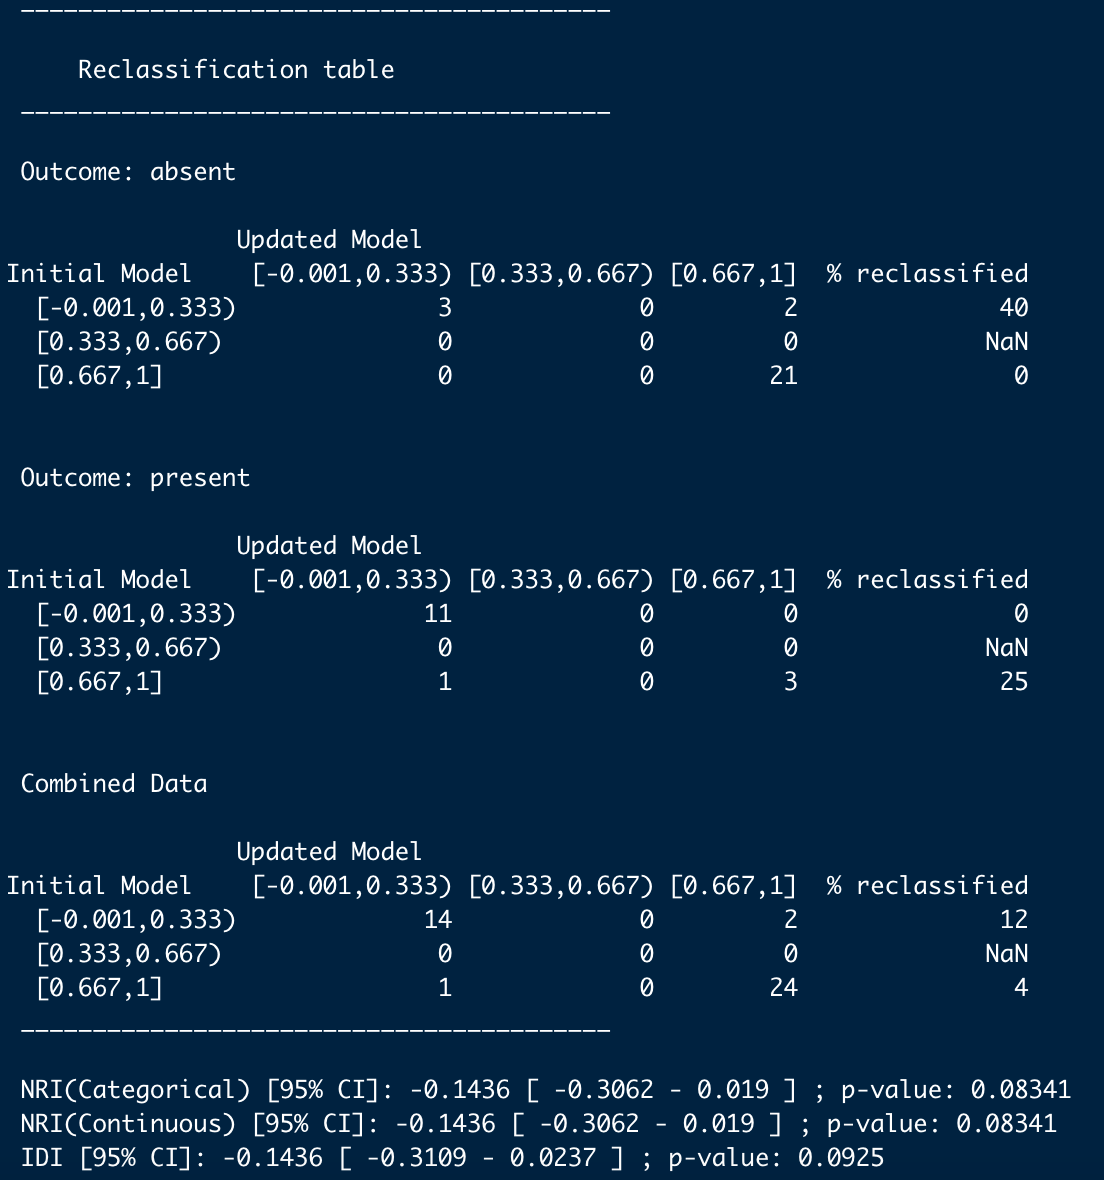
calculateNRIandIDI(df,3)
こんな感じ。

# Decision Curve Analysis (DCA)
# NRI = Delta Sensitivity + Delta Specificity
calculateNRI = function(df)
{
bestNri = 0
for (model1 in colnames(df[2:ncol(df)]))
{
model1 = as.vector(df[model1])
for (model2 in colnames(df[2:ncol(df)]))
{
model2 = df[model2]
if (colnames(model1)!=colnames(model2))
{
print(paste("Comparison of ",colnames(model1)," and ",colnames(model2)))
nri = sensitivity(factor(df$y),factor(model1[,1])) -
sensitivity(factor(df$y),factor(model2[,1])) +
specificity(factor(df$y),factor(model1[,1])) -
specificity(factor(df$y),factor(model2[,1]))
print(nri)
}
else
{next}
}
}
}
calculateNRI(df)
df = read_excel('/Users.xlsx')
base_feats <- decision_curve(fim_ent ~ age+fim_ido,
data = df,
thresholds = seq(0, 1, by = .01),
study.design = 'cohort',
bootstraps = 10)
full_feats <- decision_curve(fim_ent~age+fim_ido+hdsr+cci+tug+gait+ftsst+fm+grip,
data = df,
thresholds = seq(0, 1, by = .01),
study.design = 'cohort',
bootstraps = 10)
plot_decision_curve(list(base_feats,full_feats),
curve.names = c("Baseline model", "Full model"),
col = c("blue", "red"),
confidence.intervals = FALSE,
cost.benefit.axis = FALSE,
legend.position = "left")
summary(baseline.model)
こんな感じ。

重なっていて見辛い。すみません。
ーーーーーーーーーーーーーーーーーーーーーーーー
ここからは付録と思ってください。
ーーーーーーーーーーーーーーーーーーーーーーーー
# F1値を使ってモデル精度の優劣を比較する
# 訓練とテストデータに分ける
trainIndex <- createDataPartition(df$fim_ent, p = .8,
list = FALSE,
times = 1)
train <- df[ trainIndex,]
test <- df[-trainIndex,]
# 各モデルの訓練
lr = train(fim_ent ~ age+fim_ido+hdsr+cci+tug+gait+ftsst+fm+grip,
data = train, method="glm", family="binomial")
svc = train(fim_ent ~ age+fim_ido+hdsr+cci+tug+gait+ftsst+fm+grip,
data = train,
method='svmRadial')
rf = train(fim_ent ~ age+fim_ido+hdsr+cci+tug+gait+ftsst+fm+grip,
data = train,
method='rf')
nn = train(fim_ent ~ age+fim_ido+hdsr+cci+tug+gait+ftsst+fm+grip,
data = train,
method='nnet')
# 予測
results = data.frame(lr = predict(lr, test%>%select(-fim_ent)))
results$svc = predict(svc, test%>%select(-fim_ent))
results$rf = predict(rf, test%>%select(-fim_ent))
results$nn = predict(nn, test%>%select(-fim_ent))
results$y = test$fim_ent
# F1値
# ここでは閾値をxからxまで変化させたときに得られるF1値をプロット
f1_score = function(predictions, y, threshold)
{
precision <- posPredValue(factor(ifelse(predictions>threshold,1,0)), factor(y))
recall <- sensitivity(factor(ifelse(predictions>threshold,1,0)), factor(y))
f1 <- (2 * precision * recall) / (precision + recall)
f1
}
f1_results = data.frame(thresholds = (x:x))
v = c()
for (model in c('lr','svc','rf','nn'))
{
v = c()
for (threshold in (x:x))
{
pred = results[model]
v = append(v,f1_score(pred,results$y,threshold/100))
}
f1_results[model] = v
}
# プロット
ggplot()+
geom_line(data=f1_results,aes(x=thresholds,y=lr,color='red'),size=1)+
geom_line(data=f1_results,aes(x=thresholds,y=svc,color='blue'),size=1)+
geom_line(data=f1_results,aes(x=thresholds,y=rf,color='green'),size=1)+
geom_line(data=f1_results,aes(x=thresholds,y=nn,color='yellow'),size=1)+
scale_color_discrete(name = 'Models', labels= c("lr", "svc",'rf','nn'))